










For growing SMEs and mid-sized companies

See it sooner. Decide better. Move the business.

We bring the close, the budget, S&OP and cash into one reading of the business, so you can spot variances early and act before they hit the bottom line.

20+ years in multinationalsSenior teamOn your ERP or accounting systemFirst meeting free
In focus
Cash improvement Working capital · DSO · inventory · cash conversion
Early warningsWe flag a variance before it hits your results.
One planSales, Operations and Finance working from the same numbers.
Working capitalWhere cash is tied up and how to release it.
ADN / Management dashboardReady to decide
Sales$ 4,820 M +12.4%
Contrib. margin38.6% +180 bps
Cash cycle74 d −9 d
Forecast96% accuracy
Actual · Forecast · BudgetYear
JANAPRJULOCTDEC
Margin mix38.6%
CashAlert
DSO
+6d vs Q2
Stock
Stock +8d in 2 SKUs
AI
What to do

Margin is up, but two channels are holding back cash: they pay later and need more stock. Collections first.

Illustrative view · demo data
20+ yearsof senior finance experience
Senior teamfrom day one
Every numbercomes from your system and ties to your balance sheet
Human controlAI does the work, your team signs off
Real experience

We learned it at large companies. We apply it in yours.

We spent years building budgets, closes and plans at multinationals in consumer goods, industry and healthcare. Now we bring that discipline to SMEs and mid-sized companies that need it, without the overhead of a multinational.

Cadbury logo
Mondelez International logo
ESAB logo
Ferrero Rocher logo
Danone logo
La Serenísima logo
Frigor logo
Nestlé logo
Nespresso logo
PepsiCo logo
Biosidus logo
CID logo

The brands shown refer to the professional background of team members and do not imply a commercial relationship with ADN.

What a better decision looks like

One question. One visual. One action.

Deliverables built for decisions, not for filing.

Where do you make money, and where do you lose it?

Profitability map by channel, customer and product.

PROFITABILITY
Retail ARetail B
D2CPromo
B2BTail
ExportKey Accts
What it answers

Which customers and products make you money, and where to change the price or the way you serve them.
Are you making what you will sell?

Sales and operations plan (S&OP).

ONE PLAN
OCT
NOV
DEC
JAN
FEB
MAR
What changes

Sales, production and finance work from the same numbers.

Will cash be enough?

Cash week by week, thirteen weeks ahead.

CASH
Cash +11%Buffer 1.4xWatch week 9
ALERTW1W4W7W10W13
What it answers

When cash gets tight and how much time you have to act.

Where is cash sitting idle?

Collections, stock and supplier payments.

ALERTS
Payments stable74-day cycleCollections +6 days
ALERTTHRESHOLDOPTIMALAPRJUNAUGOCTDIC
AlertCustomers are paying later and stock is growing. First: collections and turnover.
What it answers

What is eating your cash (late-paying customers, slow-moving stock) and what to tackle first.

Why did you miss the budget?

From 18% to 14% margin: what explains the drop.

VARIANCES
Budget 18%Forecast 14%Gap −400 bps
18.0% Plan −2.0 Volume +1.0 Price −3.0 Mix 14.0% FC
SeasonalityVolume + price = −100 bps
What it answersShows what explains the gap and where to step in first.
What it answers

What explains the gap to budget, told in a way anyone at the table can follow.

What happens if you raise prices?

A forecast updated every month, with scenarios.

SCENARIOS
Q1Q2Q3Q4 BASE
OG%12.4%
EBIT13.2%
Cash1.1x

Base

  • Sales100
  • Margin38
  • EBIT13

Scenario

  • Sales102
  • Margin39
  • EBIT14

Impact

  • Pricing+2.0%
  • Mix+0.8 pp
  • Cash+0.1x
Pricing
+2.0%
Discounts
-1.5 pp
Mix
+0.8 pp
SG&A
-3.0%
Working Capital
+0.1x
Management implicationQuantifies how sensitive margin, EBIT and cash flow are to changes in pricing, discounts, SG&A and mix.
What it adds

You see how much your margin, profit and cash change if you move prices, discounts or costs, before you do it.

What is changing this month?

Early signals: what is driving results and what needs fixing.

SIGNALS
Q1Q2Q3Q4 BASE
Pricing
+2.0%
Discounts
-1.5 pp
SG&A
-3%
Margin14.8%
Cash1.2x
AlertSG&A
Next stepCut non-critical spend and hold pricing where elasticity allows.
What it shows

What moved this month, in time to react.

01 · SourceERP or accounting system
02 · Controlreconciliation and rules
03 · ModelKPIs and scenarios
04 · ExplanationAI on controlled data
05 · Decisionsenior judgment
The demo, up and running

See it end to end with a sample company.

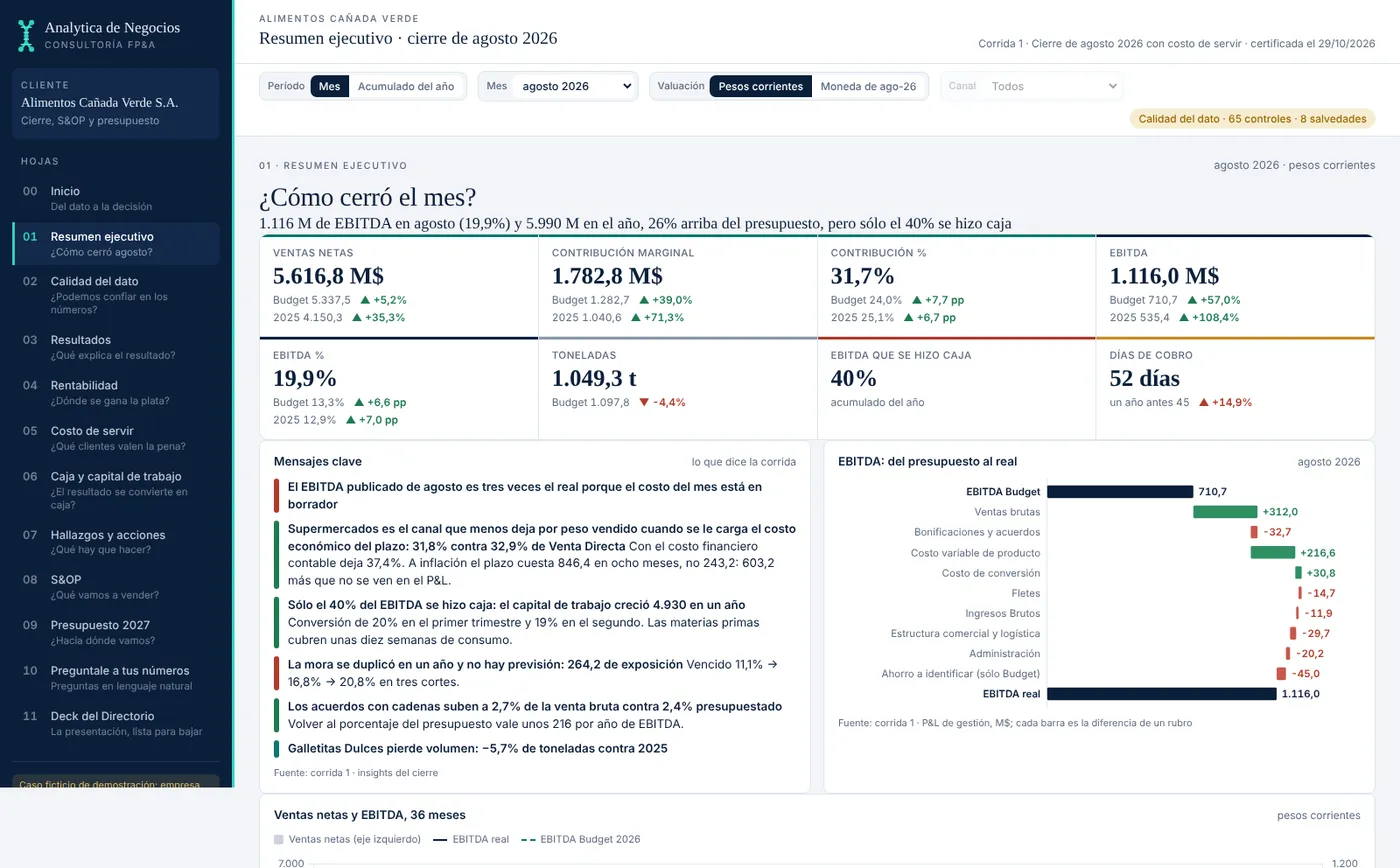
Alimentos Cañada Verde is a consumer-goods company we made up to show the full job. We started from exactly what a real system exports (invoices, journal entries, stock, collections and payments from Odoo) and ran the monthly close, the sales and operations plan and next year's budget. The screens are in Spanish.

demo.analyticadenegocios.com
August close summary for the sample company
The monthly close on one screen: sales, margin and profit against budget and last year, with the key messages already written.
How you see it

The same numbers, where your company already works.

ADN portal

Web portal with your own login

Each company signs in with its own users. Accounting prepares, each manager reviews their area and leadership approves. Who did what, and when, is logged.

Power BI

Power BI dashboards

If your company already uses Power BI, we build the dashboards there, on the same controlled data. Pick either option; the numbers are the same.

Board

A deck ready for the meeting

The close, the plan and the budget become an editable presentation for the board, partners or the bank, with every figure traceable.

What we solve

Six questions every owner or director asks. One reading of the business.

How much do you need to sell next year?

Budget and forecasts built on your business's real numbers.

BudgetScenariosForecast

Are you making what you will sell?

Sales, production and finance on one plan, so you neither run out of stock nor fill the warehouse.

DemandCapacityS&OP

Which customer or product makes you money?

Profitability by product, customer and channel, including what it really costs to serve them.

MixPricingMargin

How much did you make this month?

Your monthly numbers and KPIs on a dashboard, on our portal or in Power BI, without waiting for the year-end accounts.

CloseDashboardKPIs

Will cash be enough?

Cash, collections, stock and payments in one reading.

CollectionsStockPayments

Who do you think it through with?

A senior finance person at your side on growth, investment and banking decisions.

Finance partnerStrategyBanks
Numbers you can trust

Numbers you can stand behind in front of your board, your partners or the bank.

01

Source

Comes from your system.

02

Control

Ties to your balance sheet.

03

Model

The math, in plain sight.

04

Explanation

AI explains it in plain words.

05

Decision

Your team signs off.

We automate the work, not the accountability: your team has the final say.

See how we work
Why ADN

Senior judgment from day one.

People who have done it at large companies, working directly with you.

TeamSenior, no middlemenYou talk directly to the people doing the work.
ControlNumbers you can defendYou know where each one comes from.
TechnologyAutomation with controlLess copy-paste, more analysis. And a person always signs off.
ExperienceReal operating experienceFinance done from inside leading companies.
How we work

Start with one concrete problem. Continue once you see results.

Project

One concrete problem, with a start and an end.

  • Budget or S&OP
  • Profitability and pricing
  • Valuation, investment or dashboard
Talk about the project

Part-time CFO

A senior CFO at your leadership table, without adding headcount.

  • Support on day-to-day decisions
  • Meetings with banks, partners and investors
  • Strategy, investments and valuation
Add a part-time CFO
In-company training

A team that is stronger with numbers.

Tailored workshops for owners, managers and finance teams, on-site or remote. We work with cases from your industry and, where possible, with your own numbers.

Finance for non-finance managers

Read the P&L, margin and cash, and know which decision each number should trigger.

Budgeting and forecasting with inflation

Build the budget, update it every month and work with price and exchange-rate scenarios.

Profitability and cost to serve

Which customer, channel and product makes money once the cost of serving it is added in.

Cash and working capital

Collections, stock and payments: where cash gets stuck and how to release it.

Sales and operations planning (S&OP)

How to get sales, the plant and finance working from one number.

Dashboards and AI for management

KPIs that matter, Power BI dashboards and how to use AI without losing control of the data.

From a single workshop to a series of sessions. On-site or remote, with materials and exercises the team can keep using.

Ask about training
Resources

Ideas to make better decisions with your numbers.

Practical articles on management control and finance for SMEs and mid-sized companies, plus a guide to take with you.

Free guide

7 key financial KPIs for your SME

What to measure, how to read it and which decision each number triggers.

  • Which indicators to watch and how often
  • How to read each number
  • Common mistakes when measuring financial health
Done! You can download your guide: Download the guide (PDF)

Leave your email and download it instantly.

Before you write

What people ask us before getting started

Do you replace my accounting team?

No. Your team keeps the bookkeeping, taxes and day-to-day; we add planning, analysis and decision-making judgment, and we work with them.

Do I need to change systems?

No. We work on what your ERP (Odoo, Tango, SAP Business One or others) or your accounting system exports, and connect it to the dashboards.

What size of company do you work with?

SMEs and mid-sized companies that have their own accounting team but no planning and control function, or that have one and need more capacity and judgment.

How much time does it take from my team?

At first, meetings to understand the business and access to your ERP or accounting system data. After that, one monthly analysis meeting with leadership.

How much does it cost?

It depends on the size of your company and how we work together. We give you a concrete figure in the first conversation.

Can I see how it works before hiring you?

Yes. We walk you through the demo with the sample company, and then look at what resembles your case.

Do you work with Power BI?

Yes. You can view the dashboards on our web portal or in Power BI, if your company already uses it. Either way, the numbers come from the same controlled data.

Do you offer team training?

Yes, in-company and tailored: finance for non-finance managers, budgeting, profitability, cash, S&OP and dashboards. On-site or remote.

Is the first meeting free?

Yes. It is free and with no obligation: we understand your case and suggest where to start.

Your next move

What would you like to see, decide or change in the next 90 days?

Tell us what worries you. In a free first meeting we look at where the problem is, what information is needed and what we would deliver first.

First meeting freeConfidentialReply within 24 h
  • Emailcontacto@analyticadenegocios.com
  • WhatsApp+54 9 11 5342-2211
Thank you! We received your message and will be in touch shortly.

We reply within one business day.